AppendAnimate class
- class postmd.animate.AppendAnimate(*args, fps=20, dpi=72, range_mode='auto')[source]
Bases:
BaseAnimateanimate data by appending data to the figure.
- Parameters:
*args – a set of y data
(ydata1, ydata2, ...), orx, (ydata1, ydata2, ...). Each ydata should be a 1D array.fps (int, optional) – Frames per second (FPS) setting for animation. Defaults to
20.dpi (int, optional) – Dots per inch (DPI) resolution for animation. Defaults to
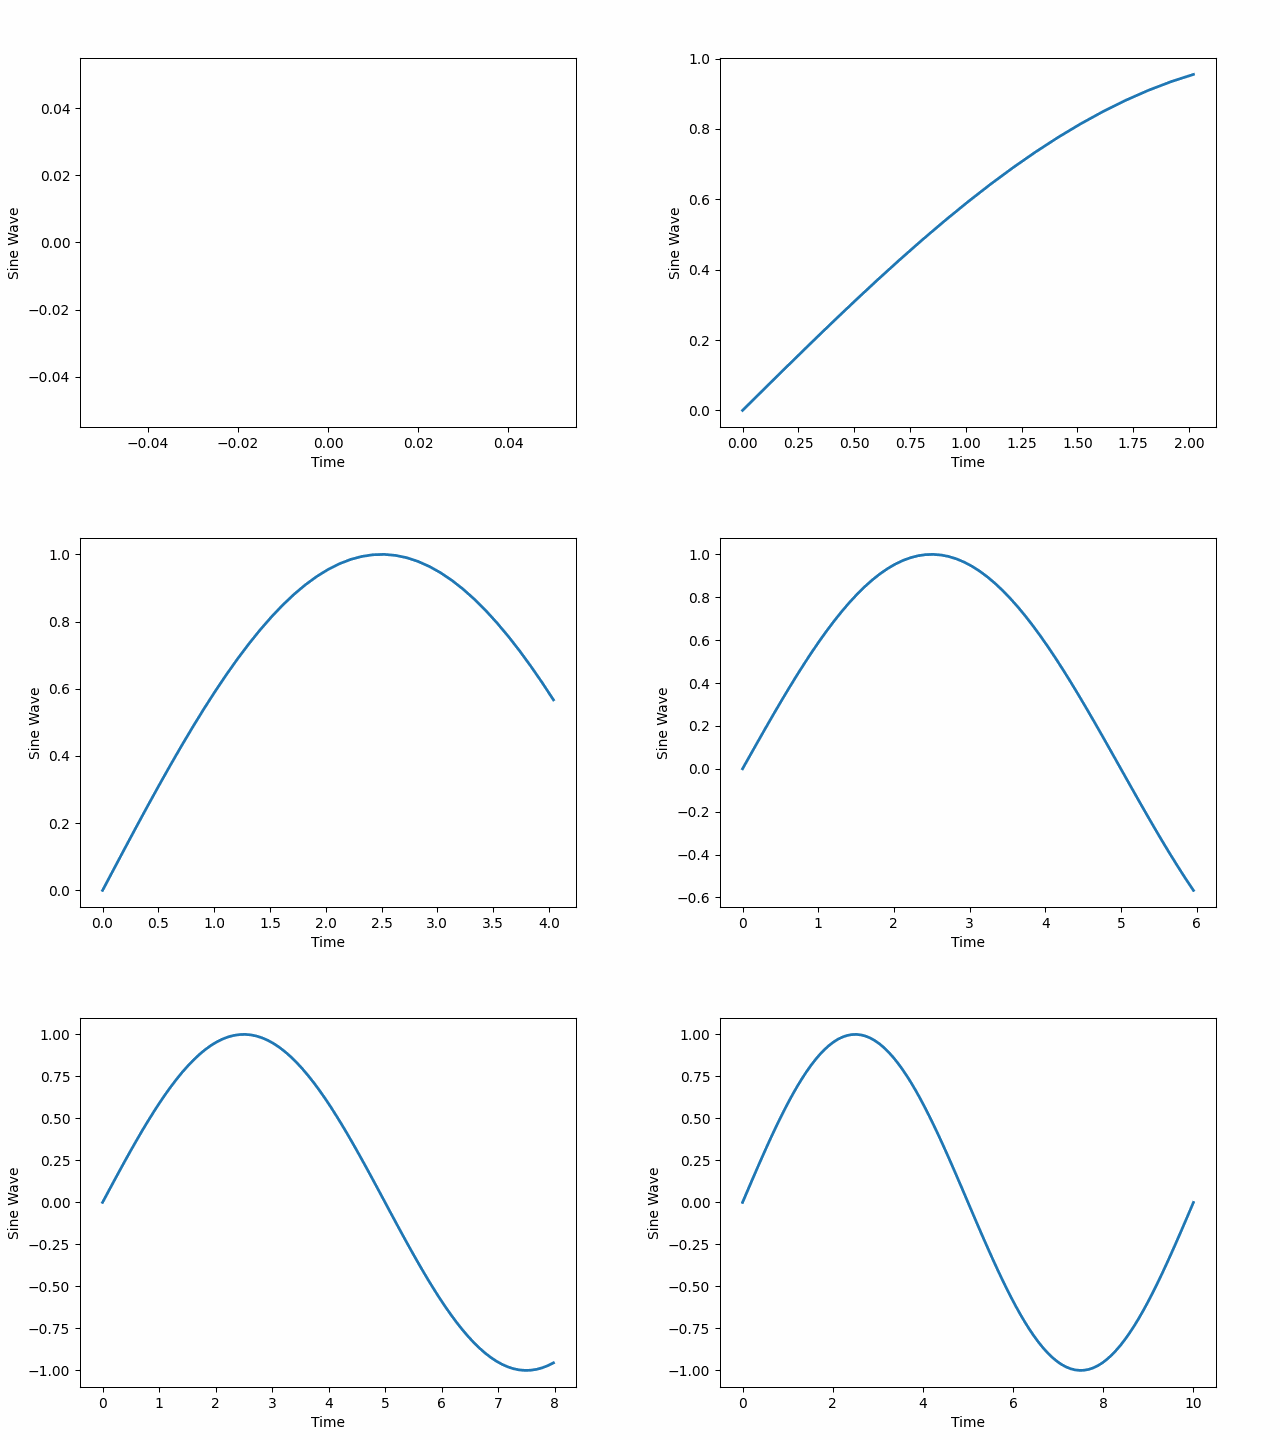
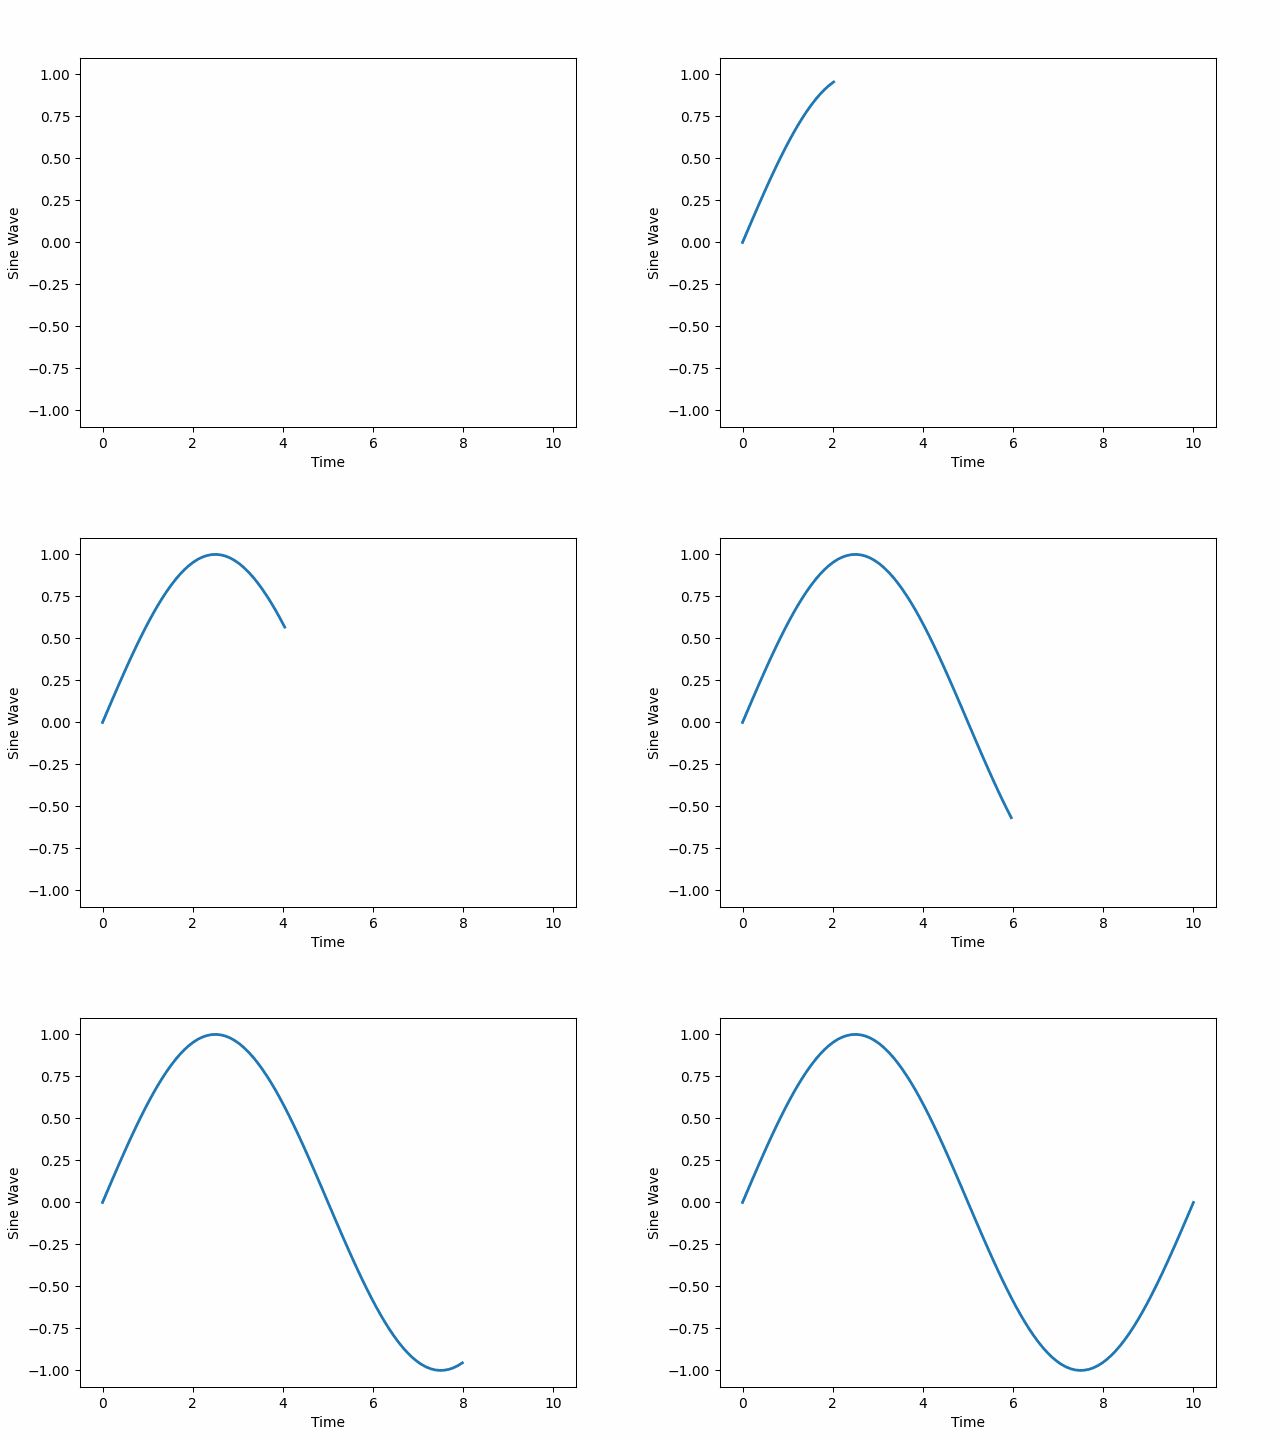
72.range_mode (str, optional) – Determines the behavior of x and y limits in the animation. Defaults to
'auto'. - If set to'auto', the x and y limits will automatically adjust to the data range. - If set to'fix', the x and y limits will be fixed to a specific range. The fixed range is from the min to max of data plus 5% margin.
- save(filename, output_format=None)[source]
save the animation of data to file.
- Parameters:
filename (str) – file name to output
output_format (str, optional) – the output format. Now only support
gif,mp4, andavi. Defaults toNone, meaning the output format is inferred from the filename extension.
Example
import numpy as np
from postmd.animate import AppendAnimate

if __name__ == '__main__':
    y_data = np.sin(np.linspace(0, 2 * np.pi, 100))  # Assume this is the sine wave data to be animated
    x_data = np.linspace(0, 10, 100)  # Corresponding x-axis data

    animator_auto = AppendAnimate(x_data, y_data, fps=20, range_mode='auto')
    # add label of x and y axis.
    animator_auto.ax.set_xlabel("Time")
    animator_auto.ax.set_ylabel("Sine Wave")
    # animator_auto.show()
    animator_auto.save("animate_sine_wave_auto.gif")


    animator_fix = AppendAnimate(x_data, y_data, fps=20, range_mode='fix')
    animator_fix.ax.set_xlabel("Time")
    animator_fix.ax.set_ylabel("Sine Wave")
    # animator_fix.show()
    animator_fix.save("animate_sine_wave_fix.gif")

animate_sine_wave_auto.gif

animate_sine_wave_fix.gif